Setting Up Alertmanager
Overview
Last time we set up Node Exporter.
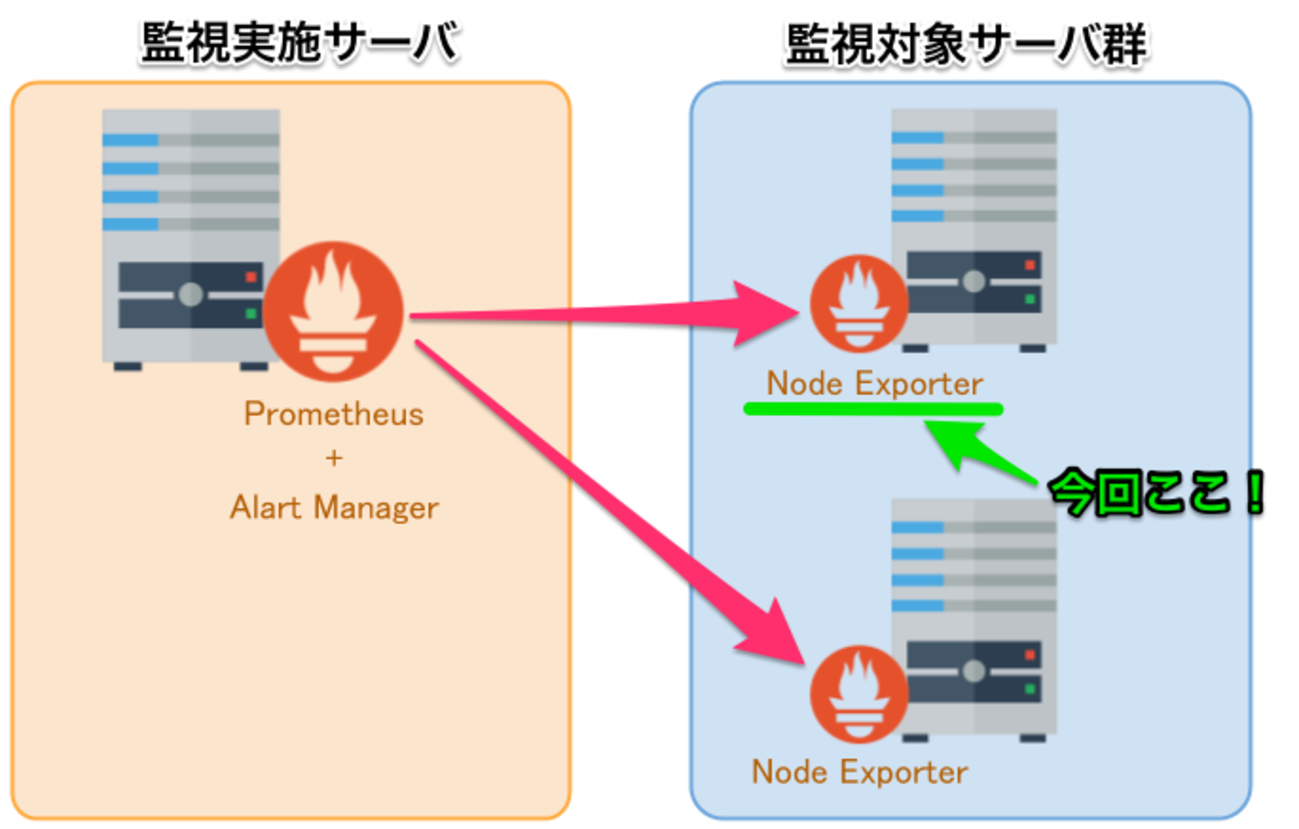
This time, we will set up Alertmanager on the monitoring server.
What We’ll Do (3-Line Summary)
- Install Alertmanager & create a startup script
- Configure notification conditions in Prometheus
- Send Slack notifications via Alertmanager

The Role of Alertmanager
It manages which destinations alerts are sent to and how frequently, depending on the alert level.
In short, it manages the notification destinations.
The actual alert conditions are configured on the Prometheus Server.
Environment
- CentOS Linux release 7.3.1611 (Core)
Installing Alertmanager
- Install the package
1 | $ cd /usr/local/src |
- Create a symbolic link
1 | $ sudo ln -s /usr/local/alertmanager/alertmanager /bin/alertmanager |
Configuring the Alert Notification Destination
Below is the configuration for sending notifications to Slack.
1 | $ cd /usr/local/alertmanager |
- alertmanager.yml
Adjust the Slack notification section as needed.
Starting Alertmanager
If you just want to start it, this is all you need.
1 | $ sudo alertmanager -config.file alertmanager.yml |
When you access http://alertmanager_server:9093/#/alerts, a screen like the following is displayed.

Just like Prometheus, we will create a startup script for Alertmanager and manage its startup there.
Creating the Startup Script
- Create the options file
1 | $ cat << 'EOF' > /usr/local/alertmanager/option |
- Alertmanager startup script
1 | $ sudo cat << 'EOF' | sudo tee /usr/lib/systemd/system/alertmanager.service |
- Startup configuration
1 | $ sudo systemctl daemon-reload |
Configuring Alert Notification Conditions
Alert notification conditions are configured on the Prometheus Server side.
Prometheus Official - ALERTING RULES
As a sample, we configure the following.
1 | $ cd /usr/local/prometheus-server |
Setting the Alertmanager URL on the Prometheus Server
Set the Alertmanager URL via the Prometheus startup options.
1 | -alertmanager.url=http://localhost:9093 |
1 | $ cd /usr/local/prometheus-server |
Note
In this case, Alertmanager is configured on the same server as the Prometheus Server, so it is
1 | http://localhost:9093 |
but if the domain differs, configure it accordingly.
Accessing the Prometheus Alerts Page
The notification conditions you configured are displayed.

Notification Test
Let’s try stopping node_exporter on the monitored server.
1 | $ sudo systemctl stop node_exporter |
Then…
A notification arrived in Slack!

When you access http://alertmanager_server:9093/#/alerts, a list of notification details is displayed.

That wraps up, briefly,
everything from monitoring remote servers with Prometheus
to sending alert notifications.
- Monitoring Servers with Prometheus
- Node Exporter Setup + Monitoring AWS Auto Scaling from Prometheus
- Setting Up Alertmanager
Supplementary Notes
Frontend
Grafana 3.x and later supports Prometheus with a default plugin, and so on,
so Grafana is easy to introduce as a Prometheus frontend and works well together.

By creating your own metrics or making full use of Prometheus’s unique queries,
you can achieve a wide variety of metric monitoring.
My alerts.rules
Learning
Having built this myself again,
I think reviewing Line Casual Talks #1 and #2 will deepen your understanding considerably.
I hope it helps.
That’s all.
Thank you for your attention.