
Writing Custom Queries for node_exporter with Shell Scripts
Overview
By placing files with the *.prom extension in the directory specified by node_exporter’s --collector.textfile.directory option,
the Prometheus server will read the metric information written in them.
The idea is that if you update these *.prom files at regular intervals, you can create your own custom metrics.
Procedure
- For installing and setting up node_exporter itself, please refer to the following.
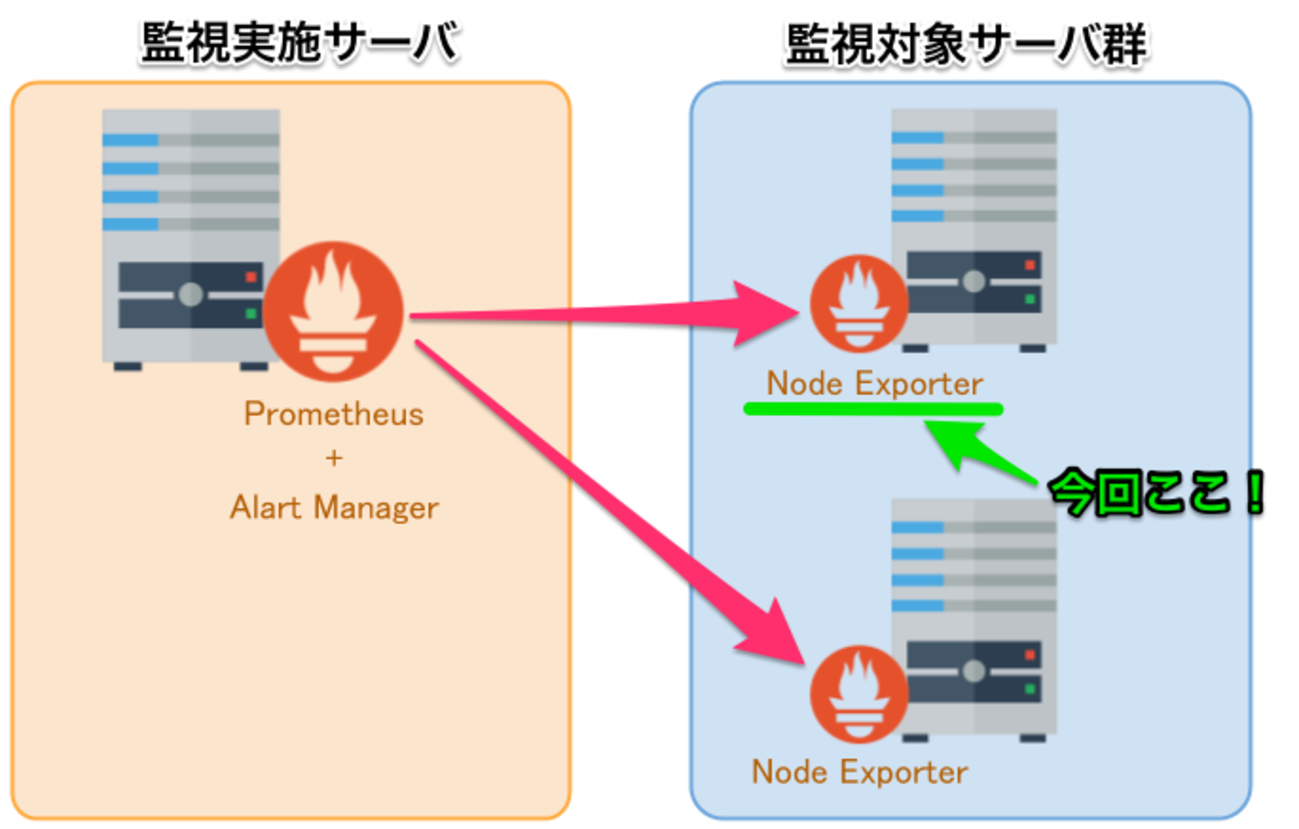
Node Exporter 構築手順 + Prometheus からAWSオートスケール監視 - 長生村本郷Engineers'Blog
以下に移行しました。 kenzo0107.github.io
In the procedure above, node_exporter is placed at the following location.
Adjust it as appropriate for your environment.
1 | /usr/local/node_exporter/node_exporter |
Create the text_collector directory
1 | $ cd /usr/local/node_exporter |
Create the shell script
This time, we will add a metric for the httpd process count.
- Create /usr/local/node_exporter/text_collector/httpd.sh
Configure cron
1 | # Update node_exporter httpd every 5 minutes |
Verify httpd.prom is created
- /usr/local/node_exporter/text_collector/httpd.prom
1 | node_httpd_count 24 |
The node_httpd_count above becomes the metric name.
Restart node_exporter
Specify the directory as follows.
1 | node_expoter --collector.textfile.directory /usr/local/node_exporter/text_collector |
Specify and verify the metric you created
It worked!

Using this, you can often get a lot done with shell one-liners ♪
I hope this helps.