Building a Development Environment with docker-compose — Visualizing Nginx Access Logs (LTSV) with Fluentd + Elasticsearch + Kibana
Overview
We’ll build a development environment with docker-compose on top of the Vagrant environment we set up previously.
Continuing from last time, we’ll visualize Nginx access logs with Elasticsearch + Fluentd + Kibana.
App
Quick Setup Steps
1 | macOS% $ git clone https://github.com/kenzo0107/vagrant-docker |
docker-compose Configuration
Everything is collected on Git.
1 | ├── docker-compose.yml |
Key Points
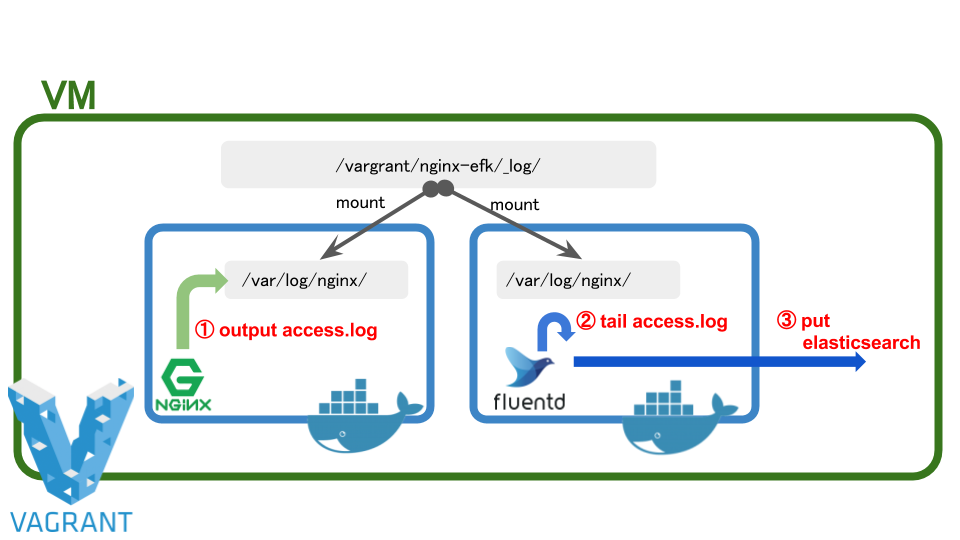
- The Nginx log directory is set as a
volumeand synced with the host side. On the fluentd side it’s also set as avolumeand tailed.
Here’s the overall picture.
Verifying Nginx Startup from the Browser
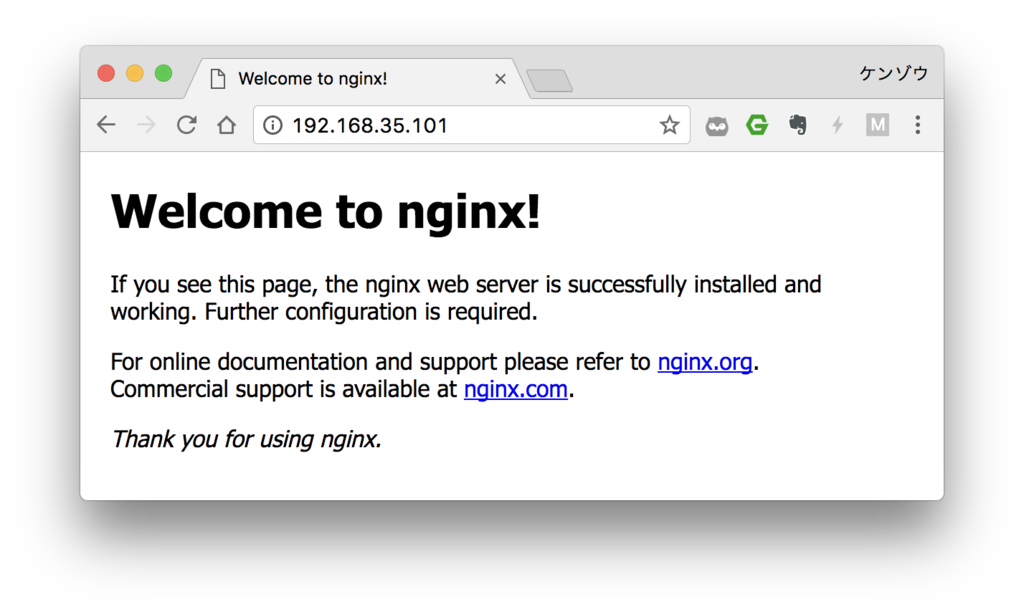
When you access http://192.168.35.101/ from your browser,
you’ll see the Nginx Welcome page.
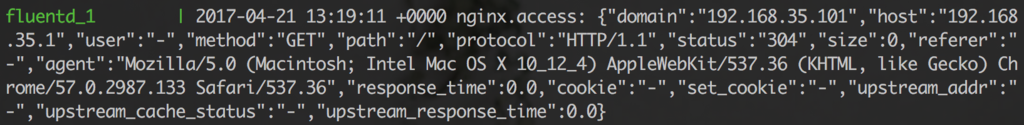
After the earlier docker-compose up, you’ll see logs like the following,
which show that fluentd is capturing the Nginx access logs.
Accessing Kibana
When you access http://192.168.35.101:5601 from your browser,
the Kibana page is displayed.
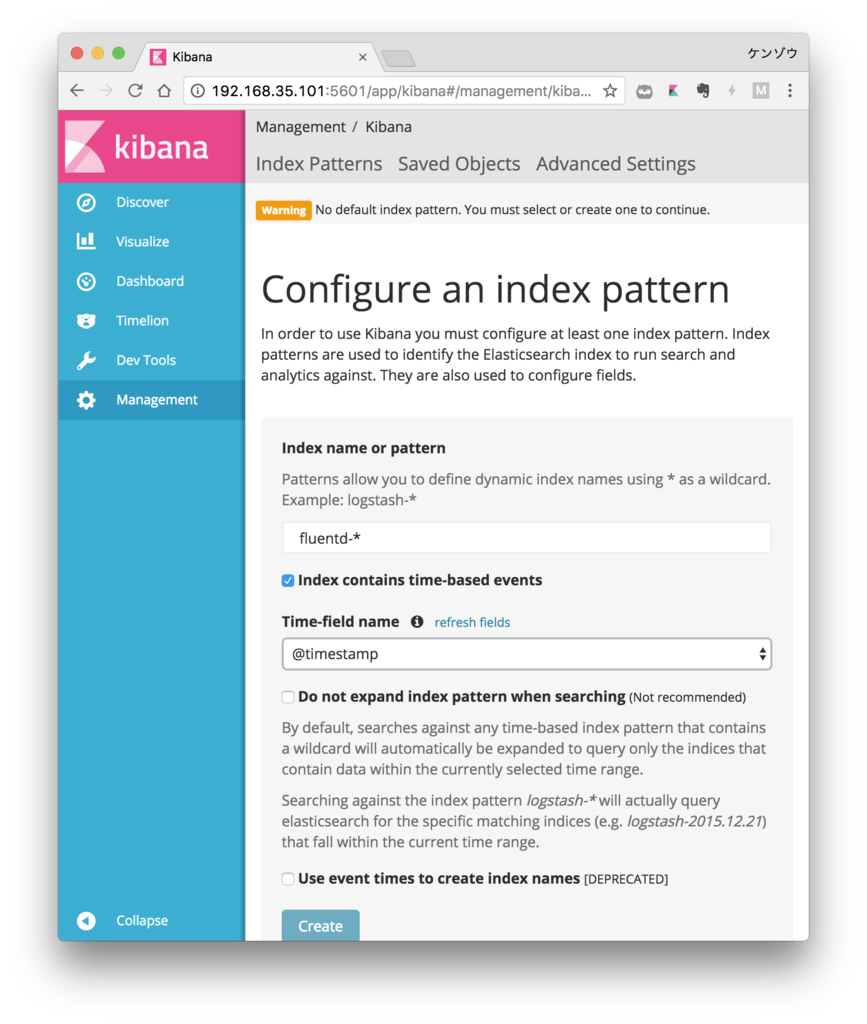
Index name or pattern
- Specify fluentd-*
Time-field name
- Specify @timestamp
Click the Create button
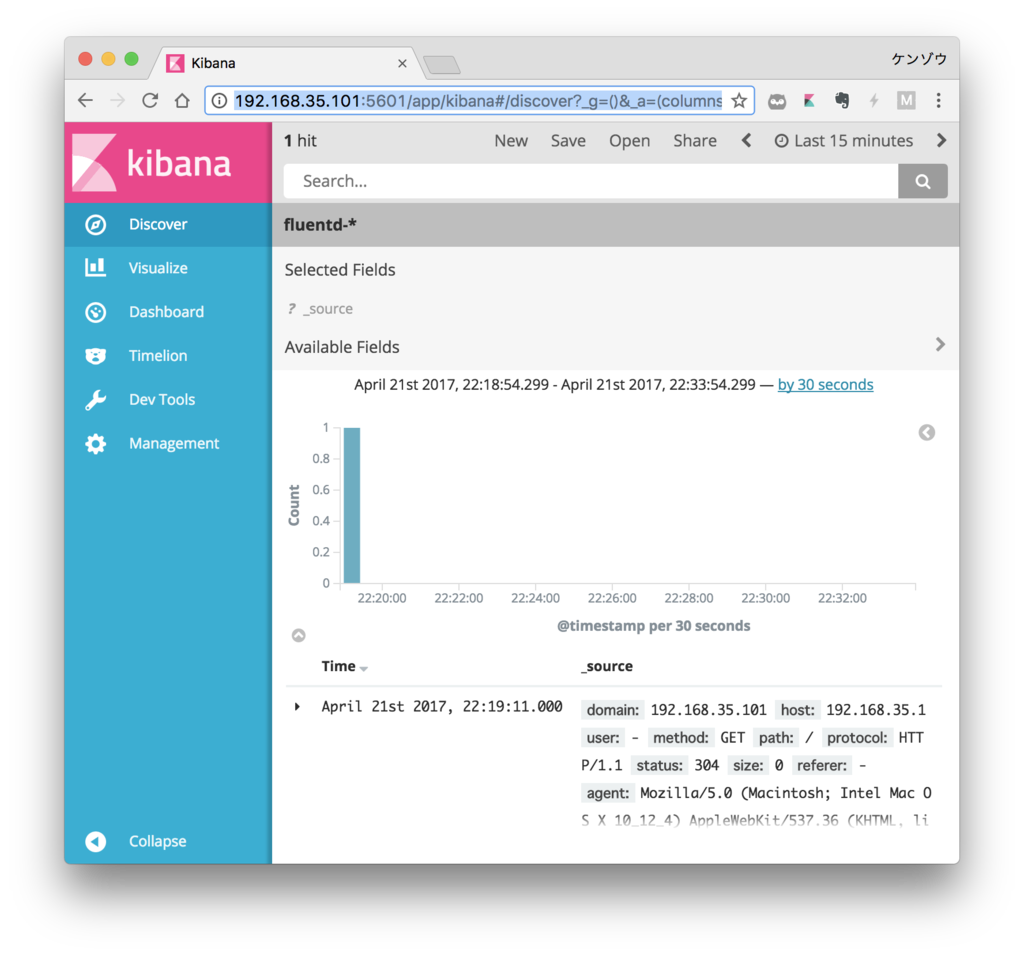
Click
Discoverfrom the left menu
Checking Logs from macOS
Naturally, since macOS and vagrant are synced,
you can tail the logs from macOS as well.
1 | macOS%$ tail -f <path/to/vagrant-docker>/docker/nginx-efk/_log/nginx/access.log |
That’s all.
I hope you find it helpful.