
Building Prometheus + Node Exporter + Grafana + cAdvisor on a Raspberry Pi 3 Model B with docker-compose, secured by Nginx authentication
Overview
I built a Prometheus-based monitoring setup on a Raspberry Pi 3 using docker-compose.
Environment
- Raspberry Pi 3 Model B (Raspbian GNU/Linux 8) arm7l
- Docker version 17.04.0-ce, build 4845c56
- docker-compose version 1.9.0, build 2585387
Installing docker on the Raspberry Pi
1 | raspi%$ wget -qO- https://get.docker.com/ | sh |
Installing docker-compose on the Raspberry Pi
1 | raspi%$ sudo apt-get update |
- Check the version
1 | raspi%$ docker-compose --version |
Setting up the docker-compose project
1 | raspi%$ cd ~ |
Configuring Nginx Basic authentication
1 | The user/password used when creating .htpasswd == GF_SECURITY_ADMIN_USER/GF_SECURITY_ADMIN_PASSWORD |
These must match.
Grafana has a mechanism that lets you log in using the Basic authentication you configured, and if they don’t match, you won’t be able to log in and the login will fail.
- grafana/env
1 | GF_SECURITY_ADMIN_USER=admin-user |
- .htpasswd
1 | raspi%$ htpasswd -c nginx/conf/conf.d/.htpasswd admin-user |
Cron configuration
This creates files (*.prom) that periodically capture the Raspberry Pi’s temperature and voltage and feed them to Prometheus.
1 | */5 * * * * <home/to/path>/vagrant-docker/docker/prometheus-grafana-on-raspi3/node-exporter/collector/raspi.sh |
Starting Docker with docker-compose
1 | raspi%$ docker-compose up -d |
Accessing Grafana
When you access http://<your_server_ip>:13000, you’ll be prompted for the user/password you specified in .htpasswd, so enter them.
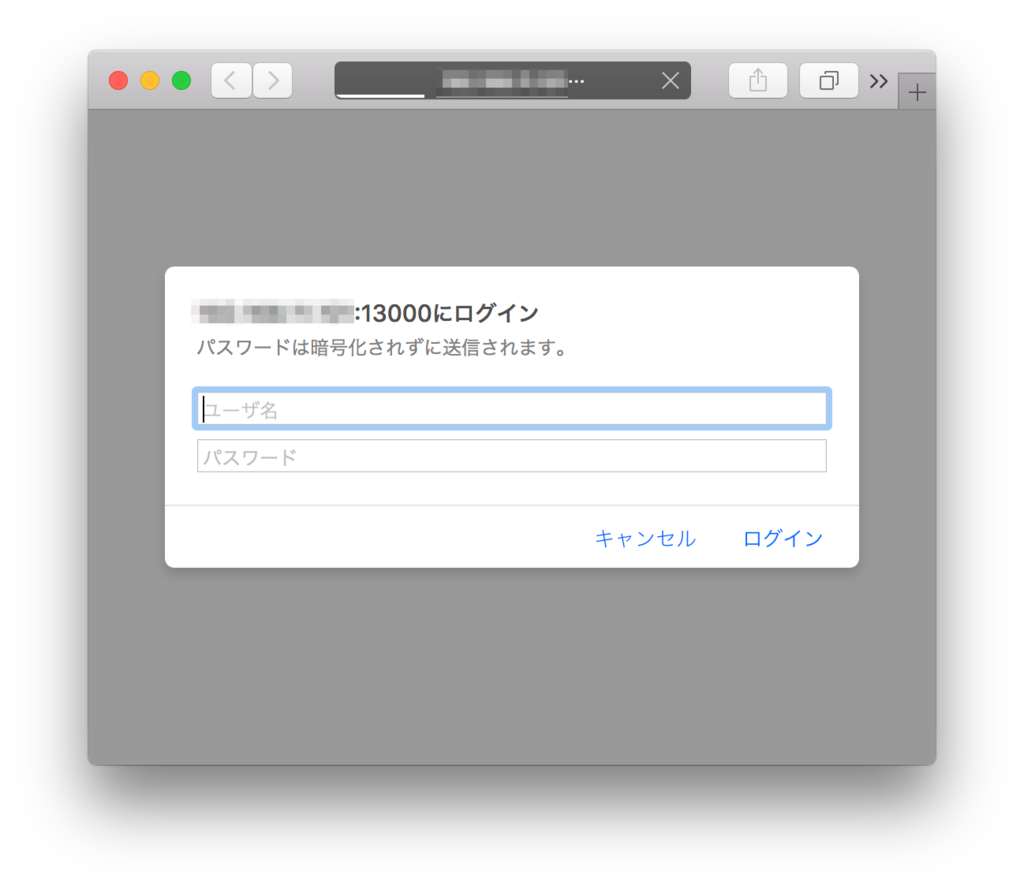
If the Grafana page is displayed afterward, you’ve succeeded.
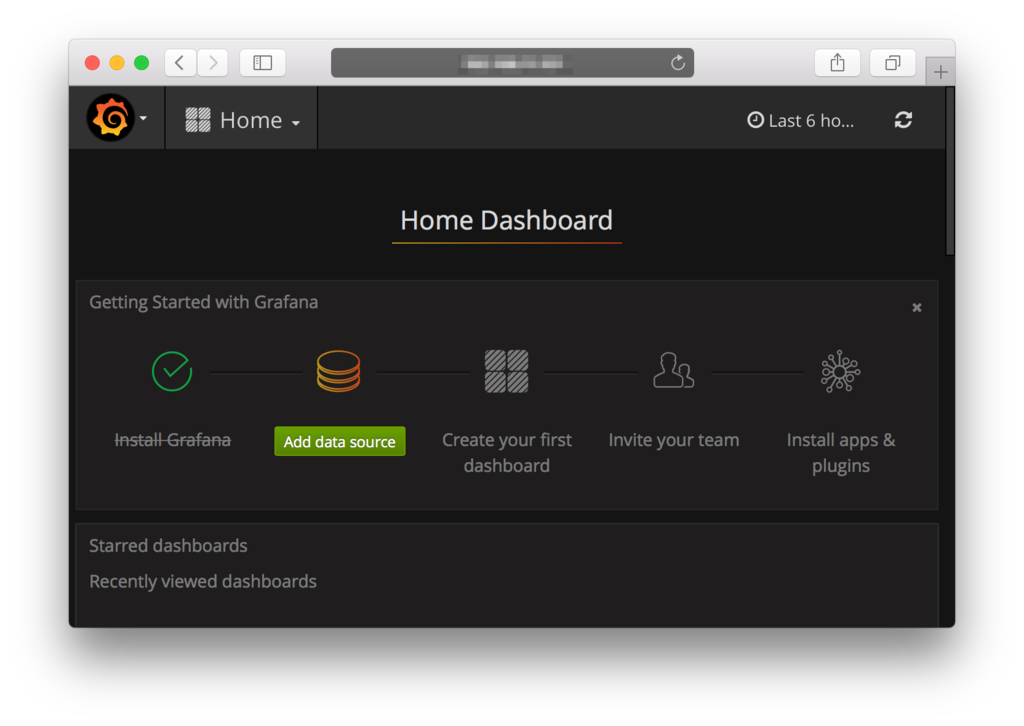
Click “Add data Source”.
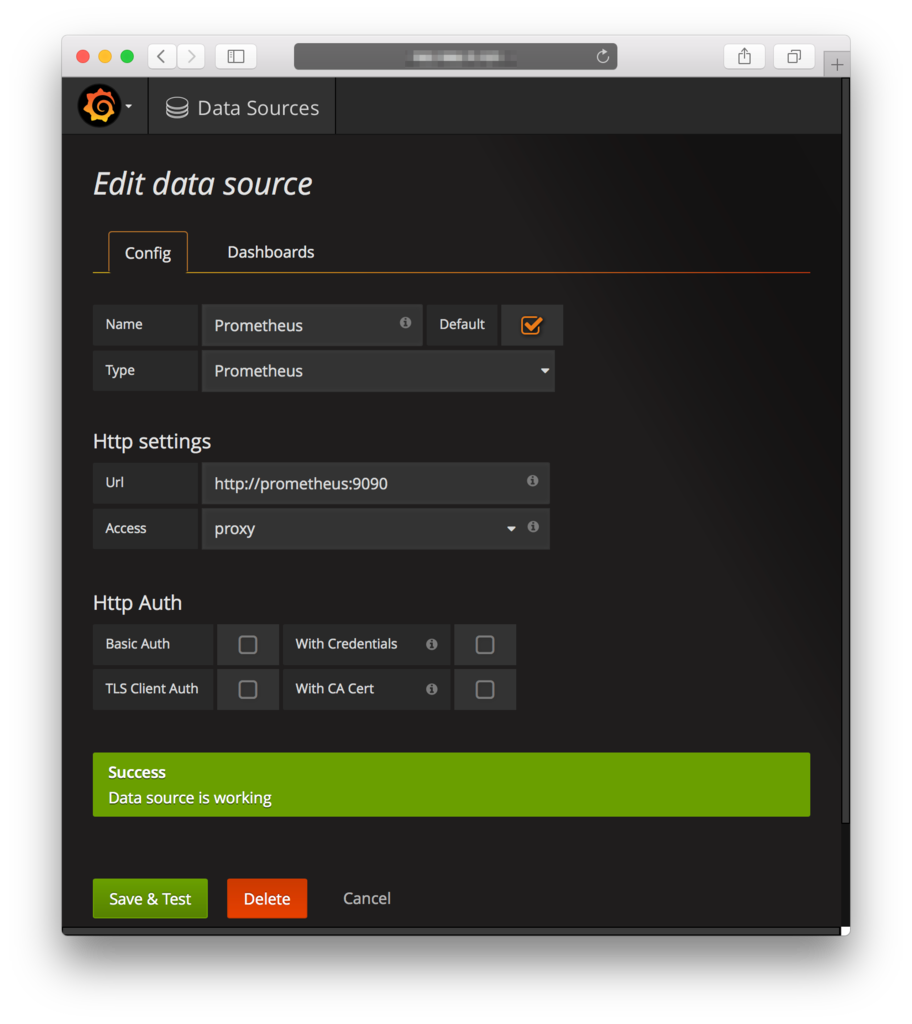
Data Source configuration
Configure it as shown below, click “Save & Test”, and confirm that it succeeds.
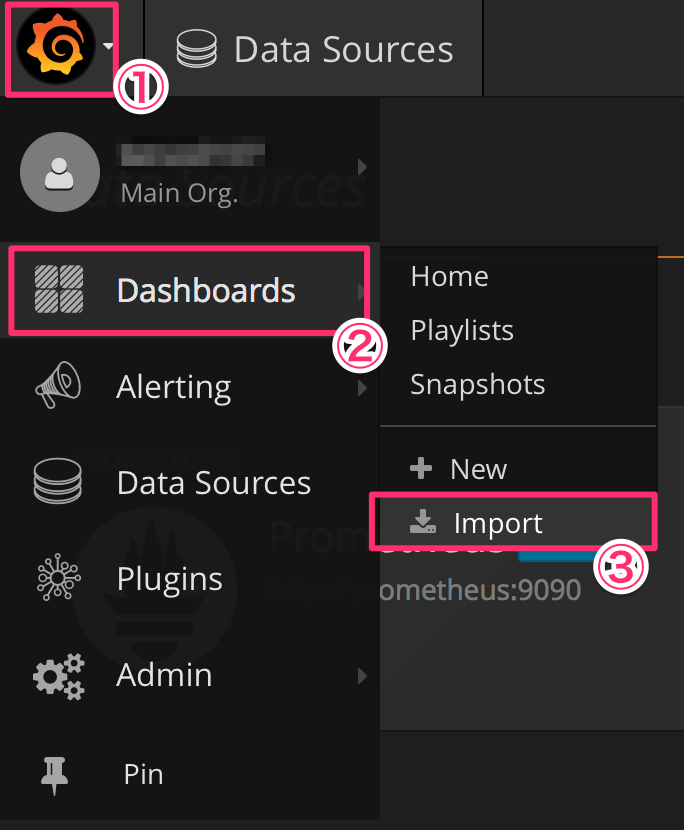
Importing Dashboard.json
From the icon in the top left, select Dashboards > Import and import DockerDashboard.json.
Displaying the Dashboard
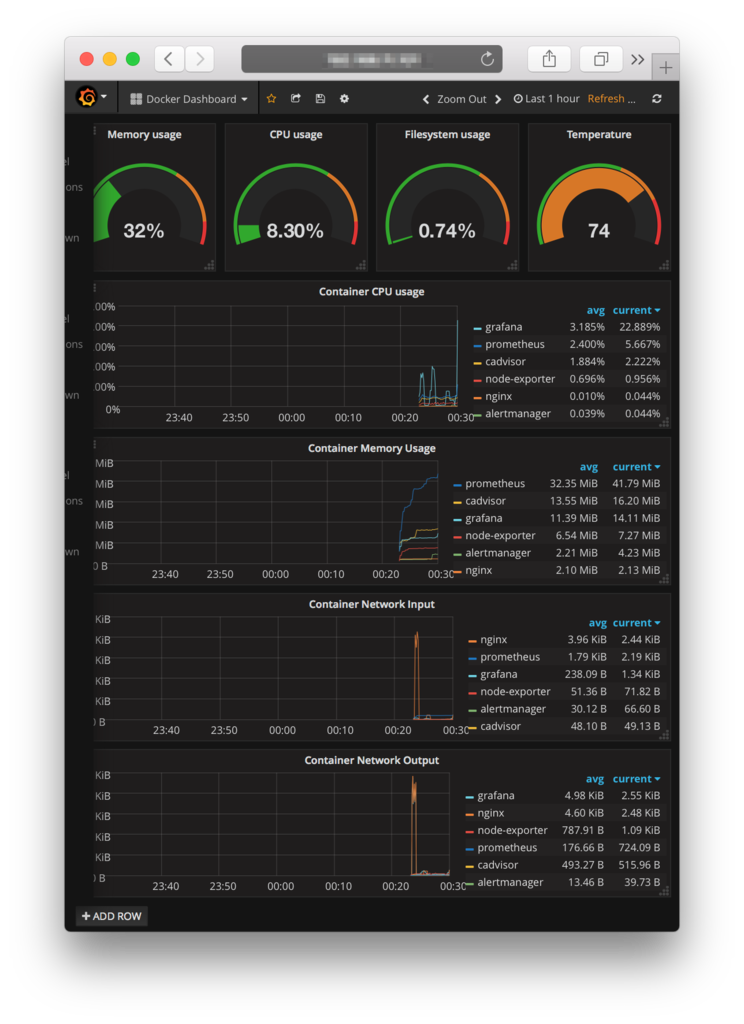
Key points!
For security reasons, I made sure Grafana cannot be accessed directly from the outside.
nginx/conf/conf.d/default.conf
1 | server { |
Choose your image carefully.
I got seriously stuck on the following points.
- Whether it runs on a Raspberry Pi 3 Model B (arm7l in this case)
- Whether Nginx’s proxy feature works correctly
I kept running into cases where, even when connecting to Grafana through Nginx’s proxy feature, it would display the following instead.
1 | {{alert.title}} |
Wrap-up
I ended up spending quite a bit of time hunting for an image, and in hindsight it might have been faster to build my own.
This time I set it up to monitor itself, but I really need a setup that monitors from the outside and where machines monitor each other. If I can get household approval, I’ll grab another unit!
And then, let’s build something that benefits the household!