
Things You Can't Ask About Now: How to Read CPU and Memory Utilization
I couldn’t hold back my feelings and gave this a rather cliché title.
To identify bottlenecks when monitoring server load, I’d be more than happy if you used this article as a tutorial to actually get your hands dirty, see things for yourself, and solve the problem.
The Server Is Hard to Connect To

- You type a URL into your browser to access a site, but the page won’t display
- The API times out
When situations like the above occur, something unusual is surely happening in your monitoring graphs.
Based on those monitoring graphs, we check the load condition that shows signs of the connectivity trouble and work to identify the bottleneck.
In what follows, to understand the underlying principles as much as possible, I’ll proceed mainly using the CLI.
Putting CPU Load on the Server

As a tool for putting load on the CPU, I borrowed the script from Examining in Detail the Relationship Between Linux I/O and CPU Load and Load Average.
Thank you, President @kunihirotanaka!
- loadtest.pl
- arg1: number of processes to run in parallel
- arg2: determines whether to run a program that makes system calls
1 | #!/usr/bin/perl |
Put CPU load on to bring the load average close to 2.
1 | $ chmod +x ./loadtest.pl |
Commands for Checking CPU Usage
- Real-time monitoring →
top,vmstat - Historical check →
sar
Real-time Monitoring
Getting an Overview with top
1 | $ top |
1 | top - 12:12:39 up 592 days, 18:55, 4 users, load average: 1.97, 1.13, 0.46 |
From the results above:
- The load average is rising
- From
%CPUandCOMMAND, the cause of the rise isloadtest.pl
As a temporary remedy, you can stop the load by killing this process.
1 | $ kill -9 6528 |
If killing a process mid-execution would cause inconsistencies, you need to consider an appropriate response depending on the situation, such as separately considering adding more CPU.
Displaying the Top 10 by CPU Usage
1 | $ ps ax --sort=-%cpu -o command,pid,pid,%cpu|head -n 11 |
The reason for -n 11 is that the first line contains the column names.
1 | COMMAND PID PID %CPU |
Looking at the Graph
Let’s check this to cross-verify the conclusions we’ve drawn so far from the CLI.
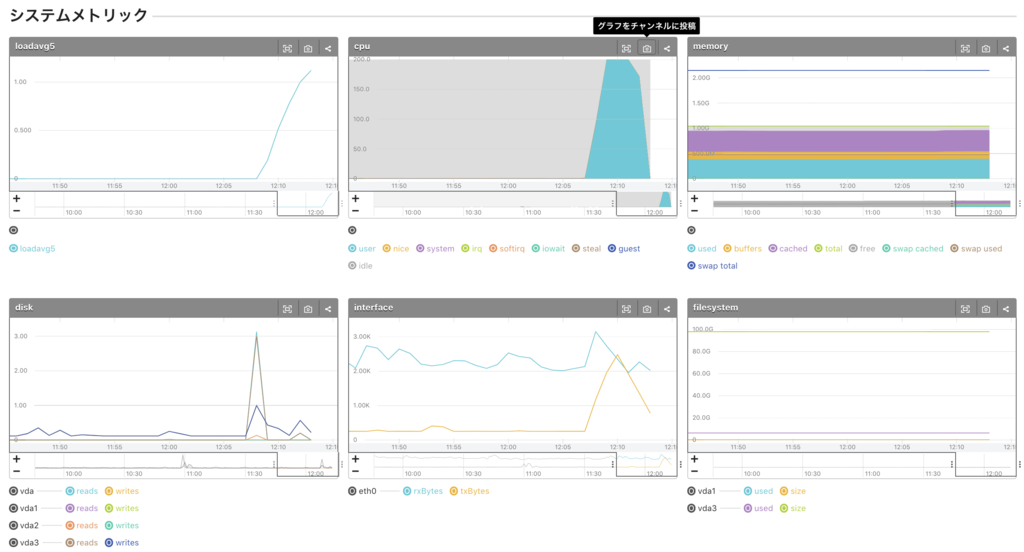
- Load rises from around 12:07
- loadavg5 spikes
- CPU user spikes. CPU system has not risen that much.
→ An application process is consuming the CPU. - memory is not being consumed
Unlike the top command, you can’t tell from the graph alone which process is the cause. You access the server and identify the cause by investigating the logs from around 12:07.
Supplementary Note
By the way, when PHP is used as an Apache module, httpd is displayed in COMMAND. Since fluentd runs on ruby, it shows as ruby.
PID USER PR NI VIRT RES SHR S %CPU %MEM TIME+ COMMAND
12376 apache 20 0 833m 115m 19m S 2.4 3.1 0:03.52 httpd
1455 td-agent 20 0 461m 74m 0 S 1.2 2.0 1098:30 ruby
Checking CPU Usage with vmstat
Output once per second.
1 | $ vmstat 1 |
From the above, the following can be confirmed:
- While
./loadtest.pl 2is running,procs r (running processes) = 2 cpu usis 100% andcpu idis 0%cpu idhas disappeared, and the program is eating up 100% of the CPU
system in(number of interrupts) andsystem cs(number of context switches) increase- Context switching itself consumes CPU and raises the system load
Historical Check
1 | $ sar -u -s 21:00:00 -e 22:10:00 -f /var/log/sa/sa31 |
The sar command is handy because you can go back and check the past.
Each Item in the sar -q Output
| Item | Explain |
|---|---|
| runq-sz | The number of kernel threads waiting in memory to be run on the CPU. Normally this value is less than 2. If the value is consistently greater than 2, the system may be reaching the limit of its CPU |
| plist-sz | The number of processes and threads in the process list |
| ldavg-1 | The load average over the past 1 minute |
| ldavg-5 | The load average over the past 5 minutes |
| ldavg-15 | The load average over the past 15 minutes |
CPU Load Involving System Calls
Put CPU load on to bring the load average close to 2 while also making system calls.
1 | $ ./loadtest.pl 2 1 |
Monitoring with vmstat
1 | $ vmstat 1 |
- Because loadtest.pl makes many system calls,
cpu syrises.
Looking at the Graph
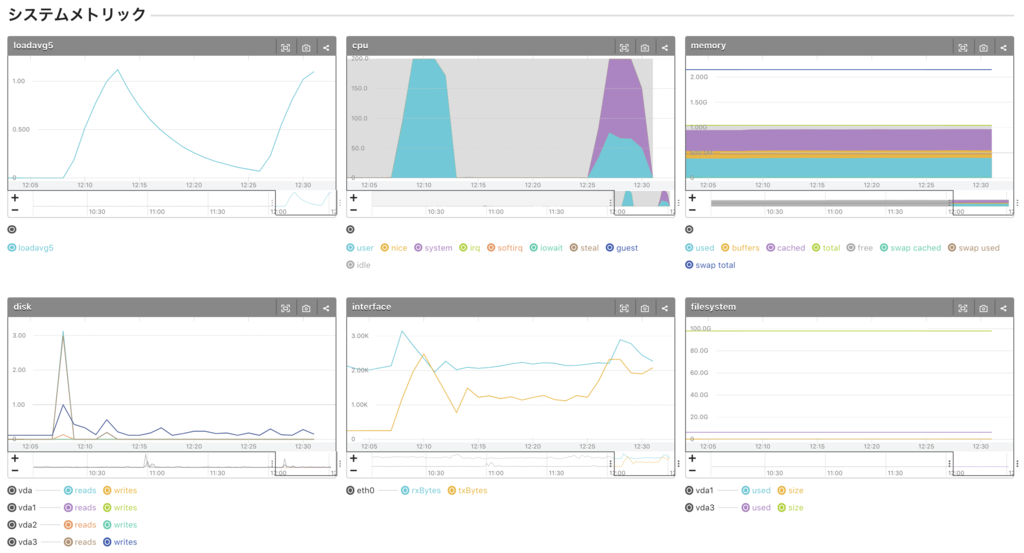
- Load spikes from around 12:25
- loadavg5 spikes
- Both CPU user and system spike. The proportion of system is larger.
→ An application process involving system calls is consuming the CPU. - memory is not being consumed
Examples of Responses
- Identifying where the application is using CPU
- Introduce APM (Application Performance Management) such as datadog or NewRelic to extract and fix application bottlenecks
- It costs money, but it’s extremely useful
- Introduce APM (Application Performance Management) such as datadog or NewRelic to extract and fix application bottlenecks
- Adding more CPU
- Killing the target application’s process (the process kill from earlier)
- e.g. when an aggregation job in the admin screen put load on the DB and affected the service, kill the aggregation process
Putting Memory Load on the Server
- memorytest.pl
Configured to consume 20MB every second.
1 | #!/usr/bin/perl |
- Running the memory load
1 | $ chmod +x ./memorytest.pl |
Commands for Checking Memory Usage
- Real-time →
top -a,free - Historical check →
sar
Checking Remaining Memory
Getting an Overview with top
1 | $ top -a |
Or, after running top, press Shift + m
PID USER PR NI VIRT RES SHR S %CPU %MEM TIME+ COMMAND
6780 mameko_d 20 0 385m 362m 1212 S 5.3 36.4 0:01.88 memorytest.pl
From the results above:
- From
%MEMandCOMMAND, the cause of the rise ismemorytest.pl
As a temporary remedy, just like with loadtest.pl, you can stop the load by killing the process.
1 | $ kill -9 6780 |
Checking Remaining Memory with free
1 | $ free |
Running it several times, you’ll gradually see the Mem values:
usedrisesfreedecreases- pulled down by the decreasing free,
buffersandcacheddecrease
Each Item in the free Output
- Mem: physical memory
- Swap: virtual memory
| Item | Explain |
|---|---|
| shared | Memory for regions that can be shared between processes |
| buffers | Memory used for buffers Memory used so that, when accessing I/O, access goes through a cache rather than going directly to I/O |
| cached | Memory for the page cache When the application needs physical memory, the cached memory is discarded |
Points to Check
From the result of the free command above, the freed memory is:
1 | Mem free 111388 kB = 108 MB |
You might be tempted to think 108 MB is what’s left, but normally, after memory is allocated to each process, the remainder is used for buffer and cache to reduce disk I/O, so buffer + cache are included as well.
Where Should You Actually Look for Remaining Memory?
free + buffers + cached
= 111388 + 29764 + 204492 kB
= 345644 kB
= 338 MB
= -/+ buffers/cache free
From the above, as a guide for remaining memory, check -/+ buffers/cache free, or check for thrashing.
How Can You Tell If Swapping Is Occurring?
Run vmstat and check whether thrashing is occurring.
How to Check for Thrashing
- If si (swap in from disk) and so (swap out to disk) occur frequently, thrashing is occurring
- If so is relatively high, there’s a strong likelihood of memory shortage
1 | $ vmstat 1 |
- bo (block out to device) … blocks sent to the block device
- bi (block in from device) … blocks received from the block device
Displaying the Top 10 by Physical Memory Usage (Resident Set Size)
1 | $ ps ax --sort=-rss -o command,pid,ppid,vsz,rss|head -n 11 |
Looking at the Graph
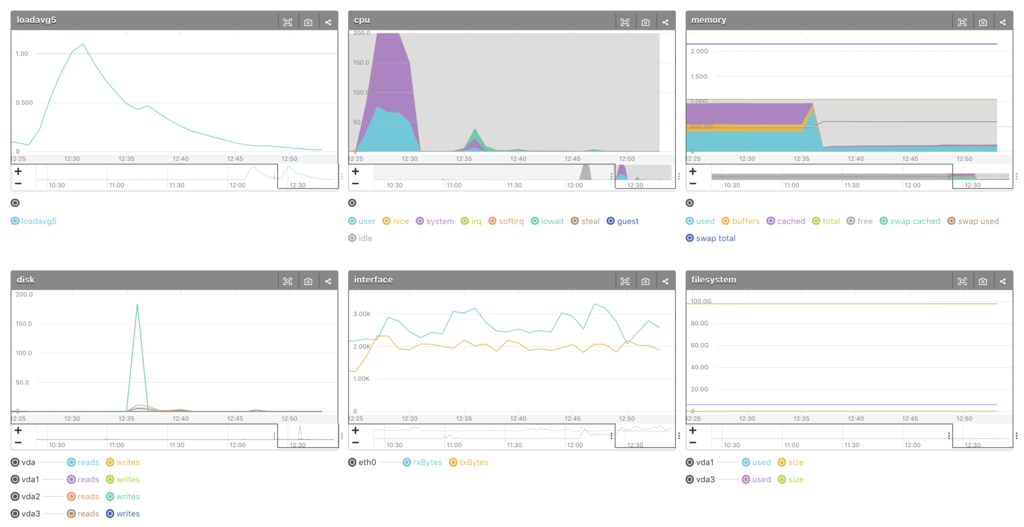
- Memory spikes from around 12:35
- cached decreases, used increases
Examples of Responses
- Monitor at the process level
- Introduce a monitoring tool such as datadog, mackerel, prometheus, or zabbix
- Adding more memory
- Killing the target application’s process (the process kill from earlier)
Disk I/O
Checking I/O Disk Usage
1 | $ sar -b -s 13:00:00 -e 14:00:00 -f /var/log/sa/sa31 |
Items in the sar -b Output
| Item | Explain |
|---|---|
| tps | The total number of transfers (I/O requests to the device) per second |
| rtps | The total number of read I/O requests per second |
| wtps | The total number of write I/O requests per second |
| bread/s | The total amount of data (in blocks) for read I/O requests per second |
| bwrtn/s | The total amount of data (in blocks) for write I/O requests per second |
Points to Check
- The mechanism by which I/O wait increases
1 | Process memory consumption increases |
Countermeasures
- Check the memory usage and Swap
Summary
Once you understand the principles behind why CPU and Memory utilization rise, monitoring feels completely different, and I really felt the graphs look entirely different.
In practice, you’ll probably end up looking at things from the graphs. At that point, if you can picture how the numbers change when you run top, vmstat, and sar, it will be a big step forward in tracking down the cause.
That’s all.
I hope this is even a little bit helpful.
Reference
- How to Read the vmstat Command
- Pinning Down the True Nature of a Single Server’s “Load”
- Server Overload Countermeasures Even “Non-Engineers” Can Do: How to Investigate Load Average, CPU Utilization, I/O Disk Usage, and Memory Usage
- How to Explore the Cause of Server Load
- Linux Performance Measurements using vmstat
- Examining in Detail the Relationship Between Linux I/O and CPU Load and Load Average
Supplementary Notes
What Is Swap?
It indicates a state where the kernel detects and evicts memory that is barely being used.
- Free memory is used for input/output buffers and cache
- Furthermore, the least active parts are evicted from memory and pushed out to swap
- They are repurposed from swap to buffers or cache
For this reason, don’t panic just because swapping is occurring.
The Significance of Using Swap
Even when out of memory, you can continue computing by evacuating part of memory to disk. The mechanism that makes it look like memory is used up while still being usable is called virtual memory.
What Is Thrashing?
It’s a phenomenon where a large amount of memory movement between physical memory and Swap occurs, delaying processing.
If You Don’t Have the sar Command, Install It
1 | // CentOS |